Implementing a Meeting Analytics Dashboard
Implementing a Meeting Analytics Dashboard is crucial for organizations to optimize productivity, time management, and cost efficiency. Learn how...
Discover the significance of a calendar dashboard in enhancing organizational productivity through effective time management and resource optimization. Gain actionable insights to improve meeting practices and project management.
Effective time management is at the heart of any successful organization. In an environment where every minute counts, understanding how time is allocated across teams and projects can significantly impact productivity, resource management, and overall efficiency. However, without the right tools, gaining a clear picture of where time goes within a company can be challenging.
This is where a calendar dashboard comes into play. A calendar dashboard serves as a powerful tool that provides a comprehensive overview of all scheduled activities, including meetings, events, and other time commitments. By collating and visualizing calendar data, it allows organizations to see, at a glance, how time is being spent across different departments and roles.
A calendar dashboard is an essential tool for organizations, offering a centralized view of all scheduled activities, including meetings, events, and other time-bound tasks. By aggregating data from various calendars, a calendar dashboard provides a comprehensive overview of how time is allocated across the organization, making it easier to manage resources and optimize productivity.

At its core, a calendar dashboard functions by collating data from individual and team calendars, presenting this information in a visually intuitive format. This includes metrics such as the number of meetings scheduled, the types of meetings (e.g., internal, external, group, or one-on-one), meeting durations, and the attendance rates of participants. The dashboard can track trends over time, such as the frequency of meetings, peak meeting times, and the consistency of agenda usage.
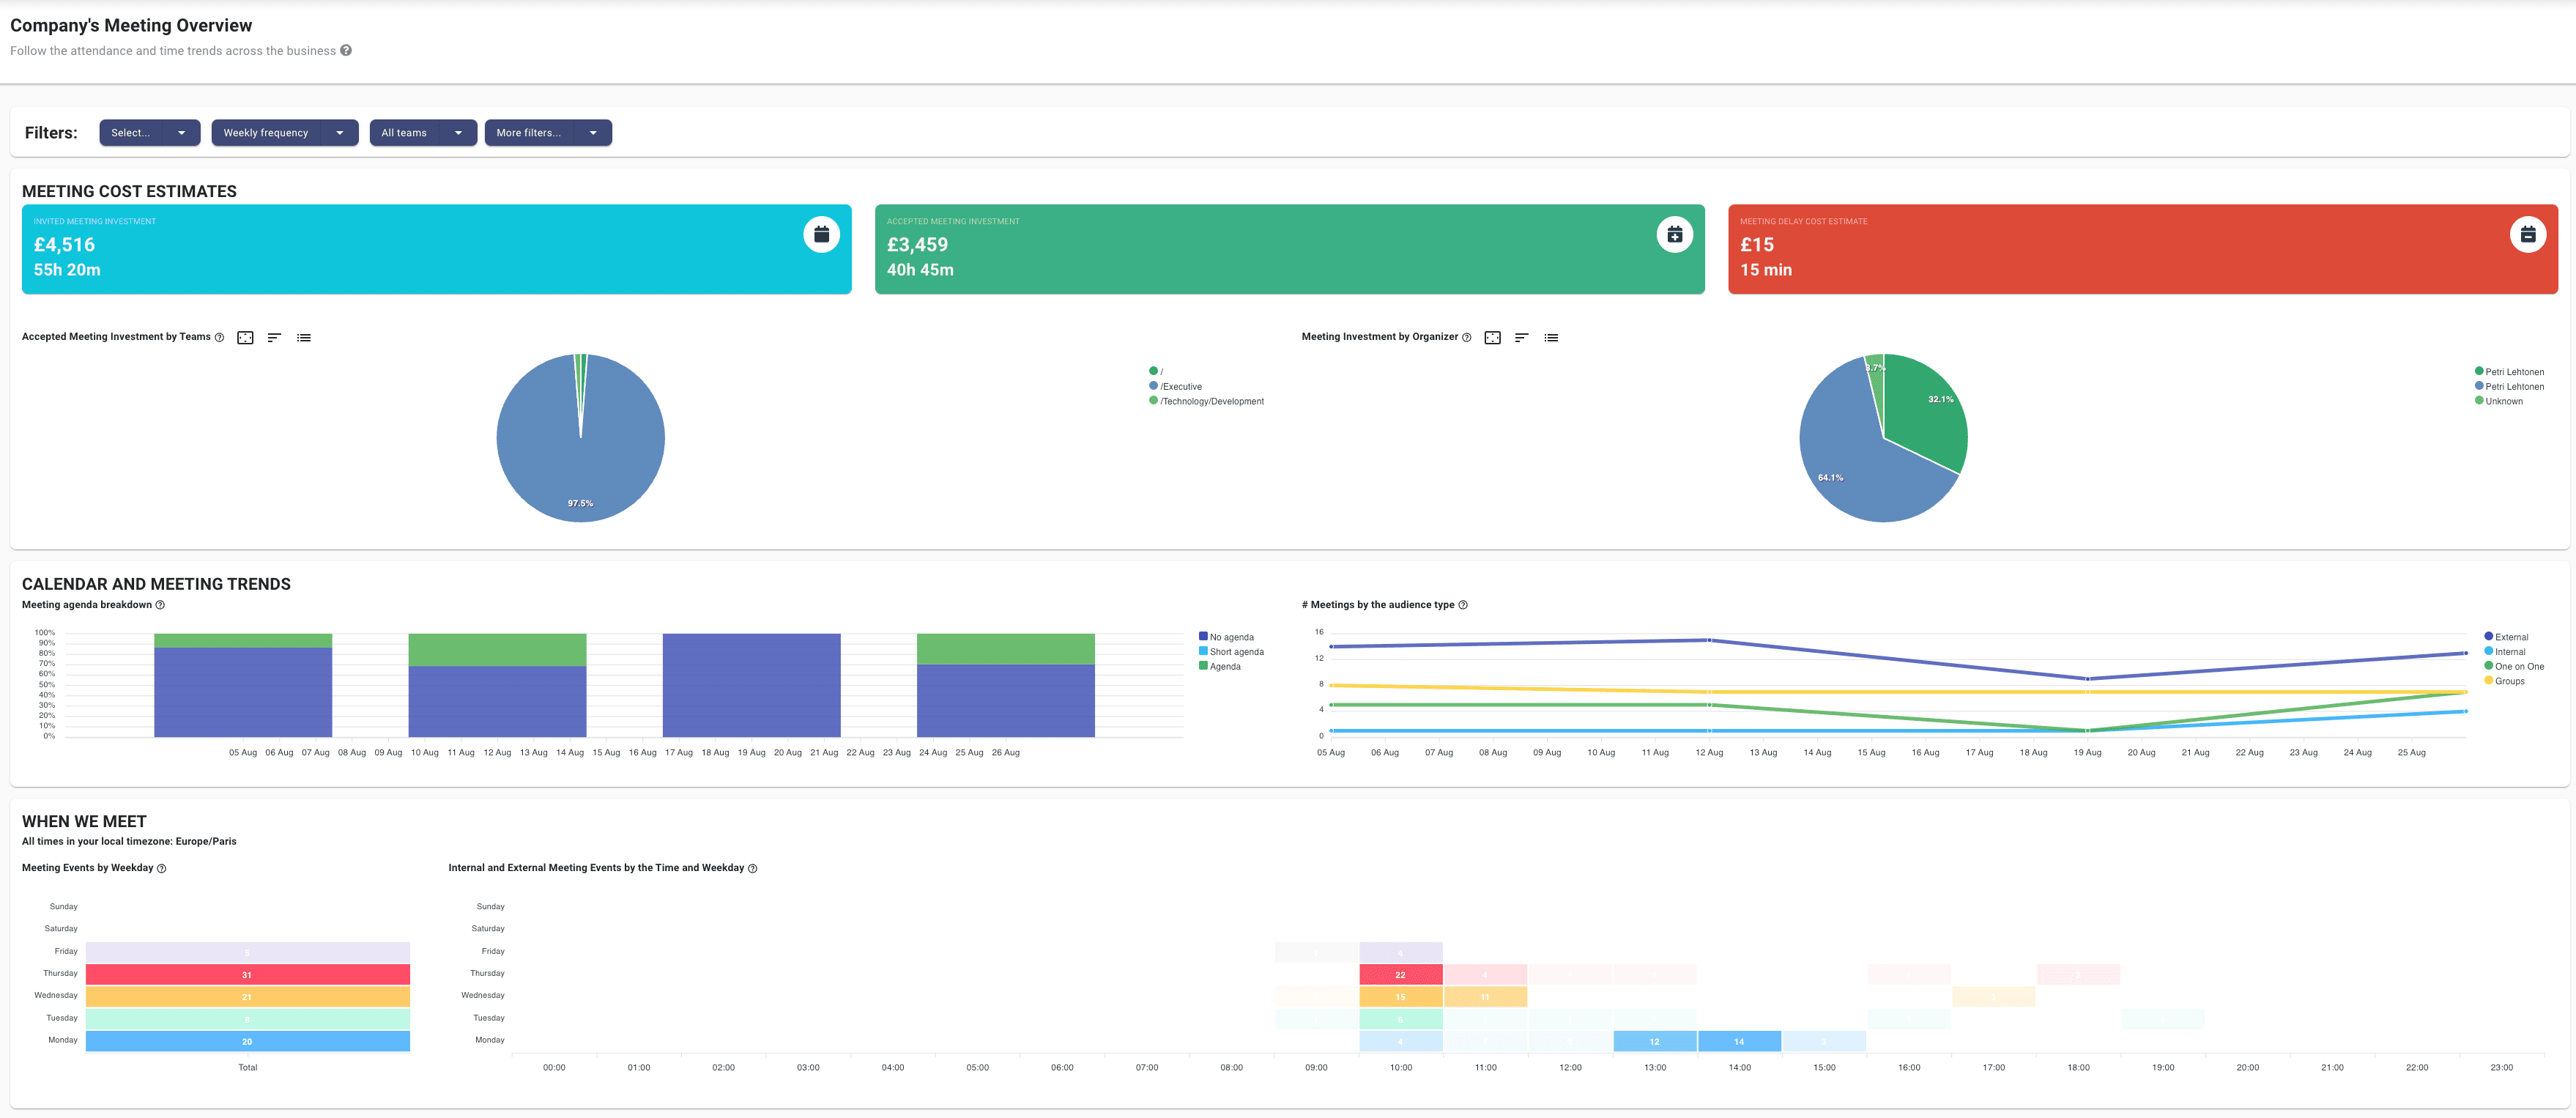
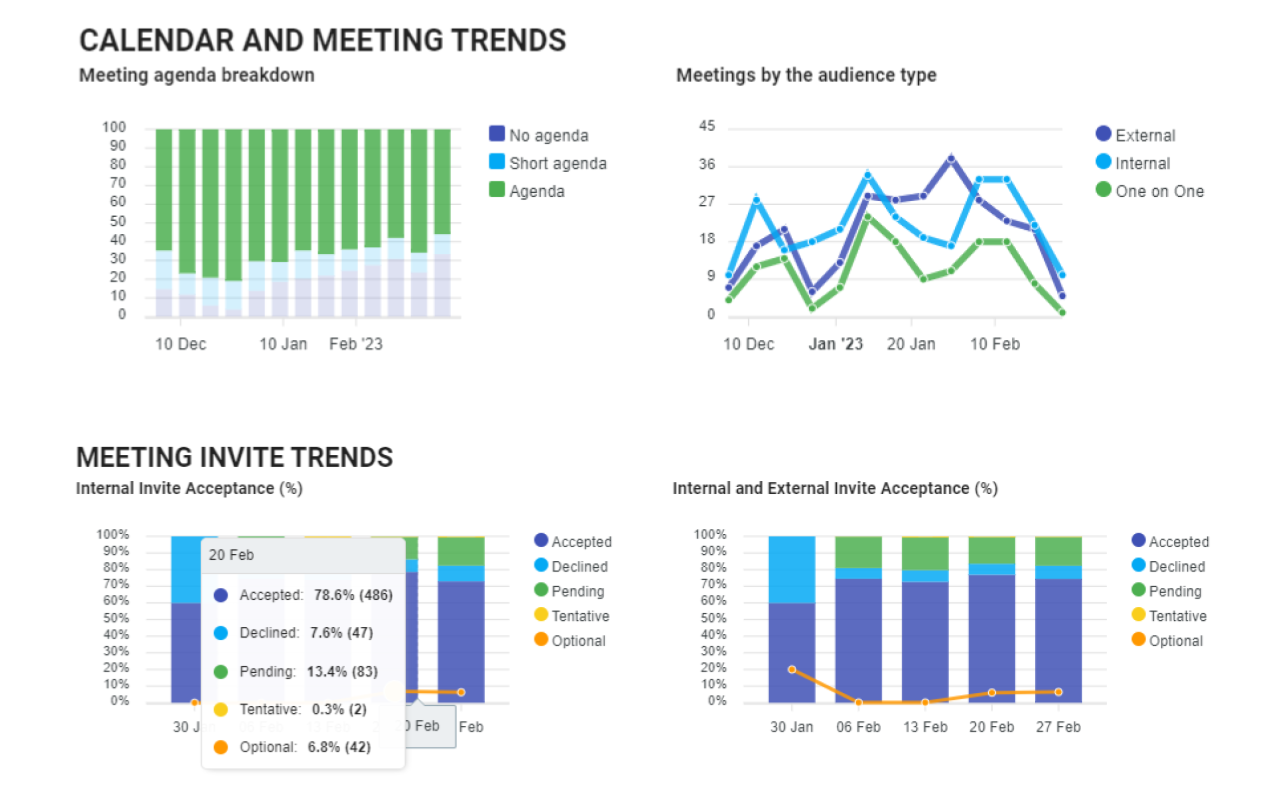
For instance, a dashboard could include detailed metrics like "Meeting Invite Trends," "Scheduled Meeting Types and Times," and "Meeting Cost Estimates." These insights help organizations understand not just the quantity of meetings but also the quality and effectiveness of time spent in these gatherings. This real-time visibility into meeting data empowers organizations to make informed decisions about scheduling, resource allocation, and meeting management.
Having a centralized view of all calendar data is critical for identifying patterns and inefficiencies in how time is used across the organization. A calendar dashboard consolidates information that would otherwise be scattered across different platforms and difficult to analyze comprehensively. This unified perspective enables managers and leaders to spot trends, such as which days are most meeting-heavy, or whether certain teams are overloaded with meetings.
For example, according to a report by Harvard Business Review, companies waste an estimated $37 billion on unproductive meetings annually. A centralized calendar dashboard can help mitigate this by providing the data needed to streamline meeting practices, ensuring that time is spent on activities that truly add value to the organization.
One of the most valuable aspects of a calendar dashboard is its ability to highlight patterns and inefficiencies in time allocation. The visual representation of data allows organizations to quickly identify issues such as:

Data from individual and team calendars can be an invaluable resource for understanding how time is allocated. A good meeting analytics dashboard would clearly show how data is segmented into different categories such as "Meeting Invite Trends," "Scheduled Meeting Types and Times," and "Meeting Cost Estimates." This organized collection of data is crucial for identifying trends and making informed decisions about time management.
A calendar dashboard includes several key metrics that offer a holistic view of how time is being utilized within an organization:


By collating and analyzing this data, a calendar dashboard provides actionable insights into how time is being utilized across teams and departments. For instance:
If the dashboard shows that certain teams are spending an excessive amount of time in meetings, it can prompt a review of whether all those meetings are necessary. This insight helps in reallocating time to more productive tasks, ensuring that employees have enough time for deep, focused work.
By analyzing participant involvement data, organizations can identify trends such as key stakeholders consistently missing meetings or a high rate of declined invitations. This information can lead to adjustments in how meetings are scheduled or who is invited, ensuring that the right people are always involved.
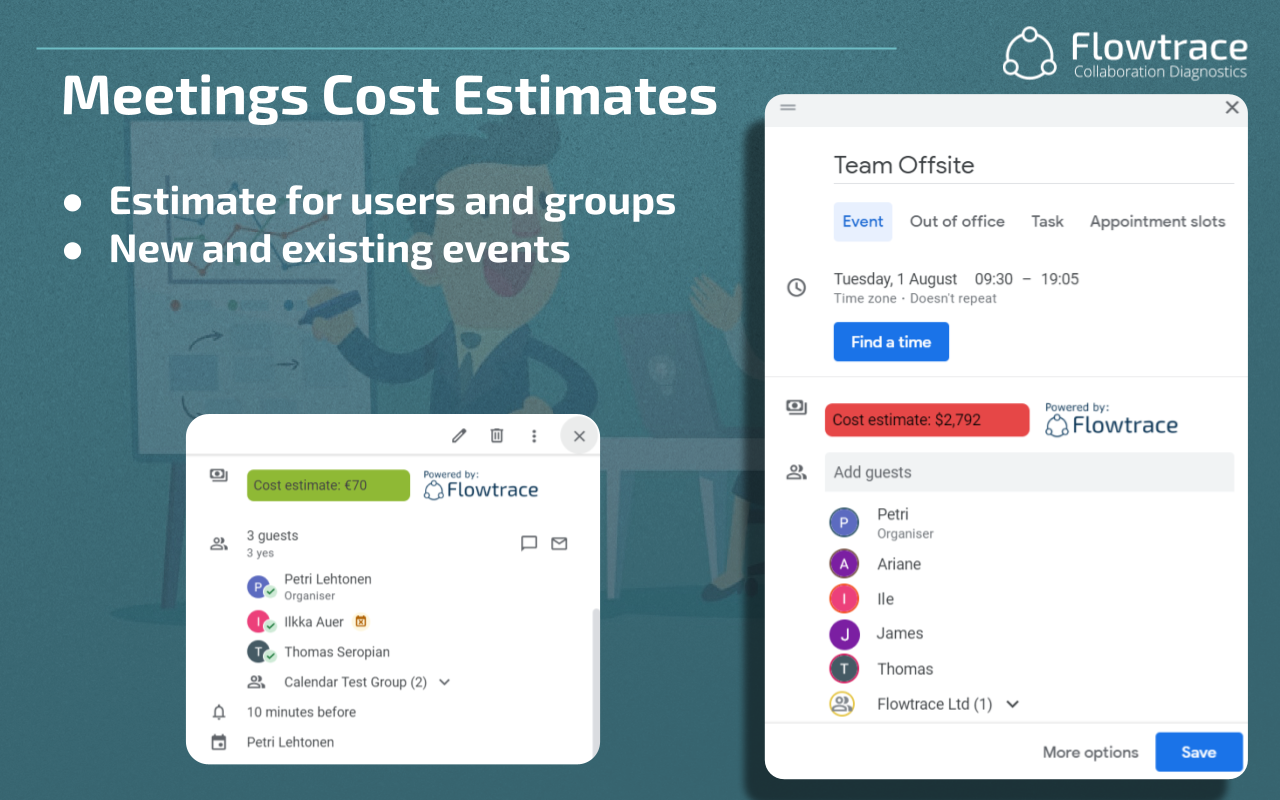
The financial metrics provided by the dashboard, such as meeting cost estimates and delay costs, allow organizations to make data-driven decisions to reduce unnecessary expenses. For example, if certain meetings are identified as high-cost but low-impact, they can be restructured or eliminated to save resources.
By tracking the duration and outcomes of meetings, organizations can identify which meetings are most effective and which are not. This insight can lead to better meeting planning, including setting more realistic agendas and time limits, ultimately improving the overall effectiveness of meetings.
A calendar dashboard provides a clear visualization of how time is distributed across an organization, offering invaluable insights into how resources are being used. By visualizing time distribution, companies can gain a detailed understanding of where employee time is going, which is crucial for optimizing productivity and improving overall efficiency.
Visualizing time distribution through a calendar dashboard allows organizations to see, at a glance, how time is being spent on various activities. This includes meetings, project work, and other scheduled events.
By presenting this data in an intuitive and accessible format, a calendar dashboard makes it easier for managers and team leaders to identify where adjustments may be needed to better align time usage with organizational goals. For example, a study by Atlassian revealed that the average employee attends 62 meetings per month, with 50% of these meetings considered unproductive(Keboola.
Understanding how time is allocated across teams and departments can significantly enhance decision-making in several key areas:
A calendar dashboard is particularly effective at identifying common time management issues that can hinder productivity:
Calendar data can support a more efficient and productive meeting culture within an organization. By providing detailed insights into how meetings are conducted, including metrics on frequency, duration, and participant engagement, the dashboard allows teams to assess the effectiveness of their meeting practices and make data-driven decisions to improve them.
For instance, dashboard visualizations could display key trends such as "Meeting Invite Trends" and "Meeting Cost Estimates." These insights help organizations understand not only the quantity of meetings but also their quality—whether they are achieving their intended outcomes or simply consuming valuable time.
Tracking specific meeting-related metrics is essential for understanding and improving how meetings are conducted:

Monitoring whether meetings adhere to their set agendas helps ensure that discussions remain focused and that the meeting achieves its intended outcomes. The dashboard’s "Meeting Agenda Breakdown" can highlight how often meetings stray from their agenda, prompting a review of meeting planning and facilitation practices.
By tracking the length of meetings, organizations can identify trends in whether meetings consistently run over time or finish early. The dashboard’s "Meeting Time Estimate Trends" provides valuable data on how meeting durations align with their scheduled time, helping organizations set more realistic time expectations and avoid unnecessary overruns.
The dashboard also tracks participant involvement metrics, such as who is attending, who is declining, and how engaged participants are during meetings. This data is crucial for ensuring that the right people are involved in meetings and that they are actively contributing to the discussion.
The insights gained from tracking these metrics can lead to actionable improvements in meeting practices:

The broader impact of using a calendar dashboard extends well beyond meeting management—it plays a crucial role in enhancing overall organizational productivity. By providing clear visibility into how time is allocated across the company, the dashboard empowers leaders to make informed decisions that optimize the use of resources and improve project management.
With better insights into time allocation, project managers can more effectively plan and coordinate tasks. The dashboard helps ensure that team members are not overburdened with meetings, allowing them to dedicate sufficient time to deep work and project-related tasks. This balance between meetings and focused work is essential for keeping projects on track and meeting deadlines.
A calendar dashboard provides detailed information on the distribution of resources, such as employee time and meeting costs. This visibility enables organizations to allocate resources more effectively, ensuring that time and budget are spent on activities that align with strategic objectives.
By optimizing meeting practices and ensuring that employees have adequate time for their core tasks, a calendar dashboard can contribute to higher employee satisfaction. Employees are more likely to feel valued and productive when their time is respected, and they are not overwhelmed by unnecessary meetings. This, in turn, leads to better job performance and a more positive work environment.
To fully leverage the benefits of a calendar dashboard, it's essential to follow a few best practices:
Flowtrace’s calendar dashboard is designed to provide a comprehensive overview of how time is utilized within your organization, making it easier to manage and optimize scheduling practices. The dashboard integrates seamlessly with popular calendar platforms, pulling in data that is then visualized in a user-friendly format to offer deep insights into meeting behaviors and time management.

Flowtrace doesn’t just stop at calendar data; it integrates this information with other organizational metrics to provide a holistic view of time management and productivity. By correlating meeting data with broader business outcomes, such as project completion rates or employee satisfaction scores, Flowtrace enables organizations to see the bigger picture and make more informed decisions.
Advanced features, such as real-time cost analysis, participant engagement tracking, and comprehensive productivity insights, take the calendar dashboard experience to the next level. By providing actionable data, Flowtrace empowers organizations to optimize their meeting culture, reduce unnecessary costs, and improve overall efficiency.
A calendar dashboard helps leaders gain insights into how time is allocated across various activities, enabling organizations to optimize their meeting practices, streamline workflows, and make informed decisions. By visualizing data such as meeting frequency, duration, participant engagement, and costs, a calendar dashboard provides a comprehensive view of time management within the organization, helping to identify inefficiencies and opportunities for improvement.
Leveraging tools like Flowtrace enhances the benefits of a calendar dashboard by providing deeper insights into meeting behaviors, participant engagement, and the financial impact of meetings. Flowtrace’s advanced features, such as real-time cost estimates and detailed trend analysis, empower organizations to make data-driven decisions that lead to more productive and efficient operations.
Implementing a Meeting Analytics Dashboard is crucial for organizations to optimize productivity, time management, and cost efficiency. Learn how...
Improve time management & meeting organization with calendar analytics for Outlook. Get insights into meeting culture, enhancing productivity &...
Comparing Google Calendar time insights with Flowtrace for advanced meeting analytics to enhance productivity and optimize organizational time and...