Meetings
How Do Meetings Influence Productivity?
Explore how meeting overload can hinder productivity and employee well-being, and discover strategies for optimizing meeting practices to enhance...
Compare weekly meeting-hour benchmarks, measure total meeting load, and decide when meetings are crowding out focus and delivery.
The average time spent in meetings is often presented as one tidy number. It rarely deserves that confidence.
One study reports scheduled calendar time. Another counts only meetings on one platform. A third includes unscheduled calls. Roles, industries, time zones and working patterns change the result again. Put those figures into one sentence and the number looks precise, but the comparison is not.
Here is the useful answer: two useful research comparison points sit around 7 to 8 scheduled meeting hours per week, while Flowtrace data shows a meaningful high-load tail above 10 hours. That is context, not a universal target. Leaders should calculate their own weekly distribution, compare people doing similar work, and check whether the meeting load supports or obstructs the work.
The best available figures do not converge on one average, but they do provide useful comparison points.
| Source | Reported meeting time | What it actually measures | Main limit |
|---|---|---|---|
| Flowtrace 2026 meeting statistics | At least 17.3% of people had 10 or more meeting hours per week; at least 4.2% had 20 or more | Weekly scheduled meeting-time distribution based on 2025 Flowtrace data | People with incomplete analytics coverage make low-hour buckets unreliable, so the high-load shares are conservative lower bounds |
| Microsoft Work Trend Index 2023 | The heaviest 25% of meeting users spent 7.5 hours per week in meetings | Intentional meeting activity in Microsoft Teams for commercial users during a 28-day measurement window | This is the highest-usage quarter, not the average employee or the full calendar |
| Stray and Moe global software-engineering study | 7 hours 45 minutes in scheduled meetings and 8 hours 54 minutes in unscheduled meetings per week | A longitudinal mixed-methods case study in global software-engineering projects | A specific profession and coordination context, not a universal workforce benchmark |
Flowtrace's figures come from its 2026 meeting statistics work, which included 1,240,880 scheduled meetings from 2025. The weekly people distribution requires an important qualification: not everyone in that denominator had complete analytics coverage. That makes the low end unreliable. The 17.3% and 4.2% shares are better read as evidence that double-digit weekly meeting loads are not rare, not as a claim about every workplace.
Microsoft's 2023 Work Trend Index adds scale through a survey of 31,000 people in 31 markets and aggregated Microsoft 365 signals. It found that the heaviest quarter of meeting users spent 7.5 hours per week in meetings. Microsoft also reported that 57% of measured app time went to communication, but that figure combines meetings, email and chat. It should never be repeated as “57% of time is spent in meetings.”
The Stray and Moe study of global software-engineering coordination is narrower and more detailed. Its participants averaged 7 hours 45 minutes in scheduled meetings, plus substantial unscheduled coordination. That context matters. Engineering work across sites creates different meeting demands from sales, customer support, recruiting or an executive role.
The practical lesson is simple: use 7 to 8 hours as one knowledge-work comparison point, not a quota. Your own median and distribution are more actionable than an industry average assembled from incompatible sources.
Suppose a 100-person company reports an average of eight meeting hours per employee per week. That sounds measurable. It still leaves most of the management questions unanswered.
The average could describe a balanced distribution where nearly everyone has six to ten hours. It could also describe 70 individual contributors with four hours and 30 managers with more than 17. Those are different operating systems.
Four distinctions prevent the number becoming false certainty.
The mean shows total scheduled meeting time divided across the population. It is useful for capacity planning. The median shows the middle person's load and is less distorted by a smaller group with very full calendars.
Report both. Then show the distribution: the share of people below five hours, between five and ten, above ten, and above twenty, adjusted to ranges that make sense for the organization. The tail often matters more than the average.
A manager coordinates people, resolves tradeoffs and coaches a team. A recruiter runs interviews. A salesperson speaks with customers. Their calendars should not look like those of an engineer protecting long blocks for implementation work.
Compare similar roles before calling one group overloaded. Better still, compare the same role over time and ask what changed in the work.
Eight hours can arrive as eight one-hour workshops or 24 fragmented 20-minute calls. The total is the same. The day is not.
If the problem is the size of individual calendar blocks, use the guide to ideal meeting length. If it is the number of separate interruptions, examine how many meetings a week is too many. Total weekly load connects those questions, but it should not replace either one.
Calendar hours omit preparation, transition, follow-up and the work required to recover context. They can also overstate a meeting that ended early or was cancelled but left on the calendar.
That does not make scheduled time useless. It makes the definition important. Use the calendar as a consistent baseline, then add actual call-time or meeting-feedback data when available and relevant.
Start with four to six representative weeks. One week can be distorted by holidays, quarterly planning, a product launch or a quiet period.
For each employee:
weekly meeting hours = sum of scheduled meeting duration in hours
Decide what counts before calculating. Exclude cancelled meetings, personal appointments and focus blocks. Label interviews, customer calls, training and all-hands sessions separately when those activities serve different work.
For a team or company:
mean weekly meeting hours = total scheduled meeting hours / people measured
Do not stop there. Add the median and practical percentile bands. Averages hide concentration; distributions reveal it.
A meeting consumes shared capacity, not only a slot on the organizer's calendar.
attendee-hours = scheduled duration in hours x participating attendees
A 60-minute meeting with eight attendees uses eight attendee-hours. A 30-minute meeting with 20 attendees uses ten. This does not make the larger meeting wrong. It makes the resource decision visible.
If the question becomes financial, use the Meeting Cost Guide to translate attendee time into a cost model without confusing cost with cash savings.
Recurring meetings create a standing capacity commitment. One-off meetings often reflect projects, incidents, hiring or customer work. A useful baseline shows both.
Convert recurring series into a weekly equivalent. A 60-minute biweekly meeting contributes 0.5 hours per attendee per week. A monthly meeting contributes roughly 0.23 hours when annualized across 52 weeks.
When recurring load dominates, review the series, owner and required outcome. The detailed process for reviewing, changing or cancelling recurring meetings covers that decision.
Two people can each have eight meeting hours and experience them very differently. One has two concentrated meeting afternoons. The other has calls scattered across every day, breaking focus into unusable fragments.
Track back-to-back chains, uninterrupted focus windows, meetings outside normal hours and when the load occurs. The broader Calendar Analytics Guide explains how load, schedule shape and boundaries fit together.
A 12-person team has 96 scheduled attendee-hours in one week. The mean is eight hours per person.
The median, however, is 6.5 hours. Three managers carry between 14 and 16 hours each, while most individual contributors sit between four and seven. The mean has hidden a concentrated leadership load.
The right response is not an eight-hour limit. First inspect the meeting families creating the managers' load. Customer escalations may be necessary. Repeated status calls across the same projects may not be. A role-specific distribution turns an abstract average into a review list.
Meetings are not time removed from work. Often, meetings are where work happens: decisions are made, risks are surfaced, customers are heard, people are coached and cross-functional problems are resolved.
That is why a balanced assessment matters. A company with too little shared coordination can create slow decisions, duplicated effort and invisible conflict. A company with too much can leave people with no capacity to execute what the meetings decided.
Romney, Allen and Heydarifard described this tension in their 2025 study of 199 full-time employees as the meeting load paradox. Participation, engagement and creative performance rose with meeting load up to a point, then fell as the burden increased. The study gives initial evidence of an inverted-U relationship. It does not give every company a universal hours threshold.
Microsoft reported that 68% of people in its 2023 survey lacked enough uninterrupted focus time. Meeting hours are only one part of that communication burden, but calendar placement can determine whether the remaining time is usable.
Protecting focus does not mean treating every meeting as an interruption. It means placing necessary coordination deliberately and keeping enough contiguous time for the work that follows.
Meeting impact continues after the call ends. A 2022 study by Allen, Thiese, Eden and Knowles examined meeting-to-work transition and recovery. Meeting outcomes were related to recovery needs, and relevance changed that relationship.
The implication is practical. Two hours of relevant decision meetings can feel different from two hours of passive attendance. Scheduled time is a useful capacity measure, but meeting relevance and outcome quality help explain the human effect.
Managers often carry the widest coordination surface. When their calendars become dense, coaching, preparation and decision work can move to early mornings or evenings. The organization may then see slower decisions even though managers appear continuously busy.
Look for role concentration rather than blaming individuals. A full calendar is often produced by unclear decision rights, too many recurring forums, attendee duplication or a manager becoming the default route for every exception.
Meeting hours are too high when the load and the work outcomes deteriorate together. The number alone is not enough.
Use these paired signals:
| Calendar signal | Work signal | What it may indicate |
|---|---|---|
| Weekly hours rise for a comparable role cohort | Delivery or decision time worsens | Coordination is consuming capacity without enough benefit |
| The average is stable but the upper tail grows | A small group works outside normal hours | Meeting load is concentrated around managers, specialists or decision owners |
| Meeting count rises while total hours stay flat | Focus windows become fragmented | Shorter meetings have created more interruptions rather than more capacity |
| Recurring attendee-hours grow | Outcomes and ownership remain unclear | Standing meetings are no longer earning their place |
| Meeting hours fall quickly | Follow-up calls, chat escalation or rework rises | Work has moved channels instead of becoming more efficient |
| Load is high but decisions and customer work improve | Participants report relevance and the pattern is sustainable | The meetings may be necessary for the current work |
A double-digit weekly load deserves inspection because Flowtrace's data shows that a meaningful share of people already sits there. It is still a review prompt, not a verdict. A recruiter running interviews, an executive in a transaction and an engineer in normal delivery work need different baselines.
When the issue is meeting quality rather than total load, use the more detailed guide to fix unproductive meetings. When the goal is reduction, having fewer meetings without losing alignment covers the replacement work that must happen alongside cancellation.
Managers should allow enough shared time for decisions, coaching and coordination while protecting capacity for preparation, follow-through and individual work. That balance cannot be set responsibly as one percentage for every manager.
Build internal ranges from the work itself:
If managers in one function have a median of 12 hours and another function has six, the difference may be legitimate. It may also reveal duplicated forums or unclear authority. The data tells you where to ask. It does not answer the management question on its own.
The Meeting Efficiency Guide uses a broader operating model: keep, remove, replace, shorten or improve, then verify. For weekly meeting load, the first cycle can stay small.
Use several representative weeks and publish the measurement rules. People should know what counts, what does not, how cohorts are formed and why the data exists.
Segment by role, team and meeting family. Look for repeated attendee groups, manager bottlenecks, recurring series and weeks where focus windows collapse. Do not turn the analysis into an employee league table.
Cancel a recurring status meeting only when the information has a durable replacement. Shorten a review only after improving preparation. Remove observers only when they still receive the decision. Concentrate meetings only when time zones and customer needs allow it.
Choose one or two guardrails before making the change: decision time, delivery, customer response, follow-up meetings, rework, participant feedback or out-of-hours work. A smaller calendar is not a success if coordination becomes slower or less visible.
Compare the same cohort and meeting family after several cycles. Keep the change when the saved capacity remains visible and the work outcome holds. Adjust or reverse it when the burden simply moved elsewhere.
One calendar is easy to inspect. An organization with many teams and recurring series is not.
Flowtrace meeting analytics uses calendar and meeting metadata to show scheduled meeting time, recurrence, attendee patterns, meeting types, cost, timing and changes over time. Leaders can compare relevant cohorts and meeting families, then see whether a change held.
The privacy boundary matters. Flowtrace does not need to record, transcribe, summarize or interpret meeting conversations. The goal is to improve the meeting system without turning meeting analytics into employee surveillance.
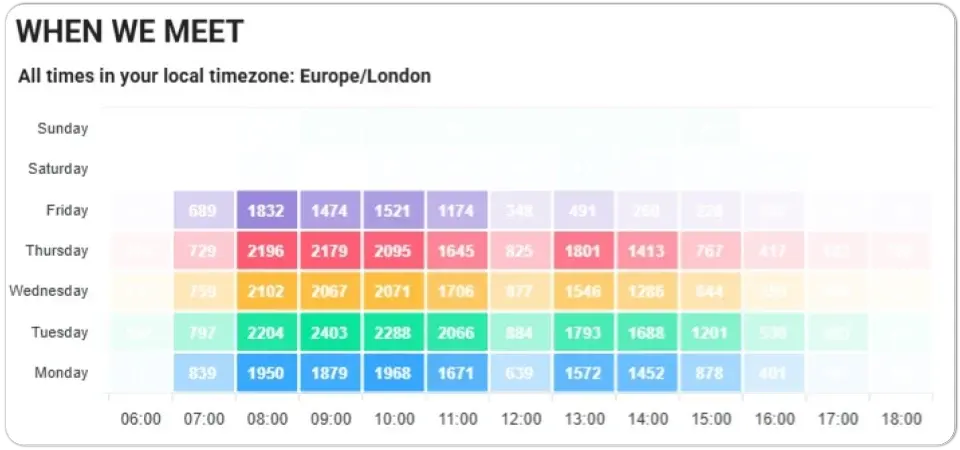
The heatmap above shows why weekly hours and schedule shape belong together. A total can tell you how much shared time was allocated. The pattern shows whether that load is concentrated, fragmented or pushed toward difficult hours.

There is no reliable universal average because studies measure different roles, platforms, and types of meeting activity. One global software-engineering case study reported 7 hours 45 minutes of scheduled meetings per week, while Flowtrace data shows that a meaningful part of the distribution exceeds 10 hours. Use published figures as context and calculate your own role-specific baseline.
Meeting hours are too high when the load is paired with blocked focus time, delayed decisions, repeated follow-up meetings, unclear outcomes, uneven role burden, or work moving outside normal hours. The threshold varies by role and meeting purpose.
Add each person's scheduled meeting duration for a representative week, then divide by the number of people for a mean. Also report the median, distribution, attendee-hours, recurring share, and schedule shape because a company mean can hide concentrated load.
Managers should allow the shared time their role needs for decisions, coaching, and coordination while protecting capacity for preparation and individual work. Set role-specific internal ranges from several representative weeks rather than applying one company-wide quota.
No. Flowtrace uses calendar and meeting metadata to analyze meeting load, recurrence, attendee patterns, timing, cost, and trends. It does not need to record, transcribe, summarize, or interpret meeting conversations.
An average is useful when it starts a better question. Where is meeting load concentrated? Which meeting families create it? What work depends on those meetings? What would improve if the hours changed?
Measure the distribution, not only the mean. Pair the calendar with the work. Then make one reversible change and inspect the result. That is how meeting time becomes a management decision instead of another workplace statistic.
Explore how meeting overload can hinder productivity and employee well-being, and discover strategies for optimizing meeting practices to enhance...
Discover how meeting-free days can enhance productivity and employee well-being in organizations, and how to effectively implement them.
Use a practical repair process to diagnose unproductive meetings, fix the main failure, and verify whether the next meeting produces a better outcome.