Meeting Analytics Every Company Should Track
Discover essential meeting analytics to track, improve collaboration efficiency, and boost productivity in your company. Learn how to use data to...
Meeting statistics for 2026 based on proprietary data from millions of meetings. Understand the impact of meetings on productivity and efficiency.
Article Updated December 2025.
'About Data: Meeting insights in this report are based on Flowtrace’s analysis of 1.3 million real meetings across modern workplaces and combined with external statistics sourced from reputable publications and academic research. This dataset comparison gives us a clear, evidence-driven view of how meetings actually run and where inefficiencies appear. It also positions Flowtrace as a trusted benchmark for tracking meeting behaviour year over year.'
Meetings are an essential part of business operations, promoting opportunities for collaboration, decision-making, and strategy development. However, as the workplace continues to evolve, so do the patterns and impacts of these meetings. In 2025, we see many trend shifts where the frequency, format, and effectiveness of meetings are under constant scrutiny, prompting businesses to reassess their meeting cultures. These meeting statistics highlight the importance of assessing your meeting culture.
Flowtrace has also published its State of Meetings Report where we look at how the current meeting landscape is influenced by the data analyzed.
Flowtrace has valuable insights into meetings through extensive data analysis of 2025 calendars, covering 1.3 million meetings and 1.75 million hours of meeting time. These statistics reveal how modern meeting habits are shifting toward shorter, smaller, and more disciplined collaboration. Below are five standout statistics, along with an analysis of their significance:
Median Meeting Duration: 35 Minutes (Only 12% Exceed 60 Minutes)
 Most meetings now sit in a tight, focused range, with a median duration of 35 minutes and only 12% running longer than an hour. This points to a shift away from sprawling sessions toward more intentional use of time. For leaders, the question becomes less “How long should this be?” and more “What can we cut?” Shorter meetings only work when they are scoped tightly, so making sure each session has a clear purpose and outcome is critical.
Small Meetings Dominate: 64% Have Six or Fewer Participants (Only 8% Have More Than Ten)
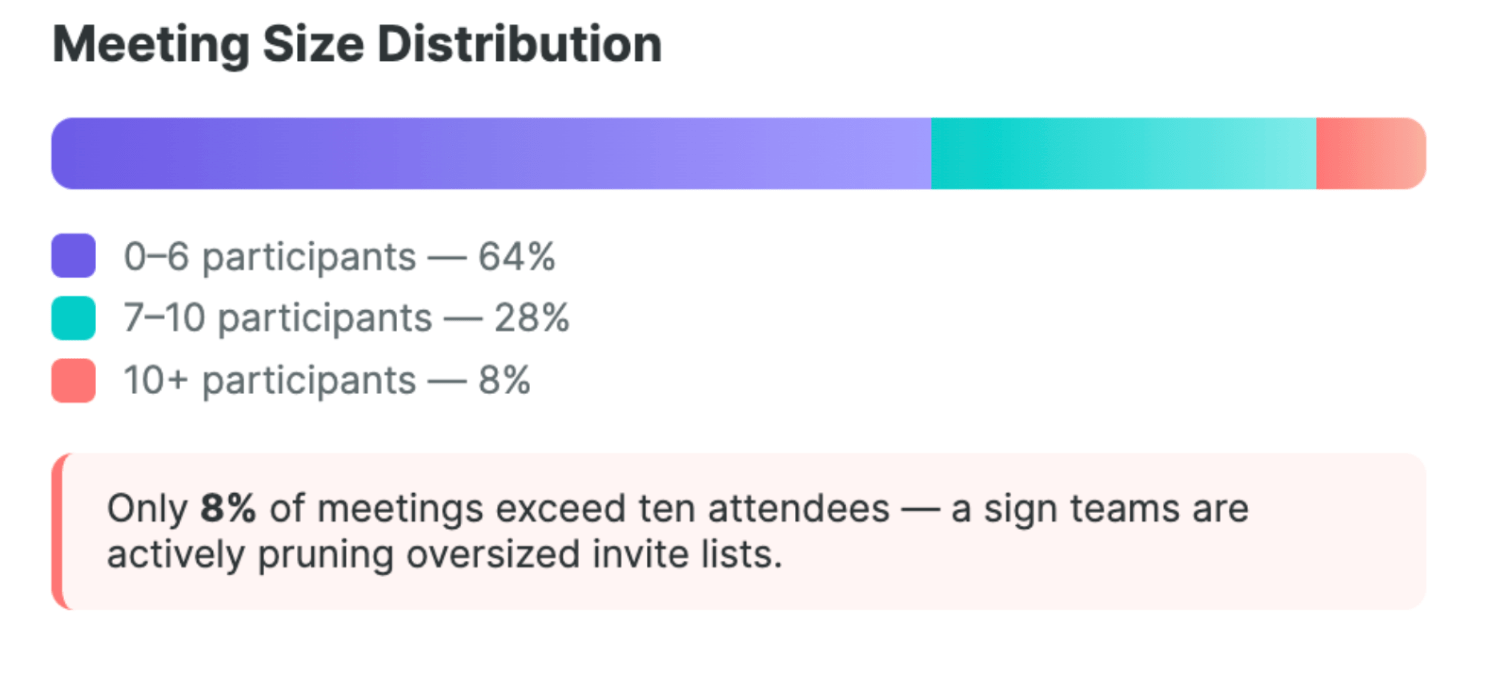
Nearly two-thirds of meetings bring six or fewer people together, while just 8% cross the ten-participant mark. This indicates a stronger bias toward leaner discussion groups where decisions can be made faster and ownership is clearer. Oversized attendee lists are still a source of waste, but the data suggests that many teams are already optimizing invites to those who actually need to be in the room.
Recurring Meetings: 48% of All Meetings, Averaging 28 Minutes vs 41 Minutes for One-Offs
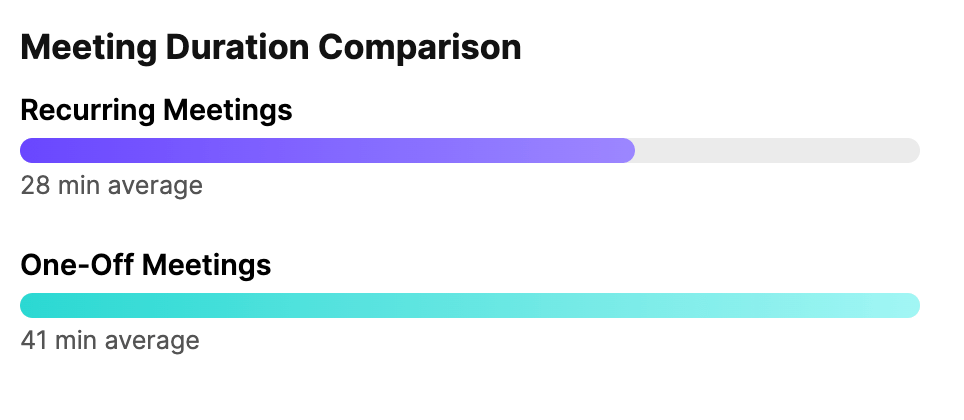
Almost half of all meetings are recurring, and those recurring sessions are significantly shorter (28 minutes) than one-off meetings (41 minutes). This pattern shows that teams are building structured rhythms for check-ins instead of relying purely on ad-hoc calls. When designed well, recurring meetings become lighter, predictable alignment points rather than heavy, time-consuming status updates.
Agile Scheduling: 35% of Meetings Scheduled 24 Hours Before Start (Only 8% >7 Days Ahead)
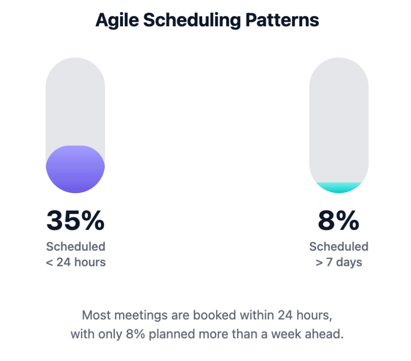
Scheduling behaviour has shifted toward agility: 35% of meetings are created within 24 hours of their start time, while only 8% are booked more than a week in advance. In practice, this reflects faster decision cycles and more responsive coordination across teams. It also means calendars are more dynamic, so teams need clear priorities and guardrails (no-meeting blocks, focus time, core hours) to avoid constant interruption.
Punctual, High-Discipline Video Calls: 24-Second Average Delay, 84% Start Within One Minute

Video calls now start with minimal delay: the average join lag is just 24 seconds, and 84% of meetings begin within the first minute. Compared to global hybrid benchmarks of 1–2 minutes of delay, Flowtrace customers start meetings up to four times faster. That may sound small, but at scale it signals stronger meeting discipline, better tooling, and fewer micro-delays that compound into lost hours over the course of a week.

These top meeting stats provide a crucial overview and paint a clear picture of the current state of meetings. Here, we will explore a range of key insights from recent studies and surveys, shedding light on how meetings are being conducted, their frequency, duration, and overall impact on productivity and efficiency.
Employees spend about 392 hours per year in meetings (10 full workweeks)
Spending roughly 392 hours a year, or 10 full workweeks, in meetings shows how deeply meetings are embedded in knowledge work. That time is before you even count prep, follow-up, or the context-switching cost between meetings and deep work. For leaders, this isn’t a marginal optimisation problem, it’s a question of whether a double-digit share of every employee’s year is creating value or simply maintaining the status quo (Flowtrace).
Around 1 in 10 employees logs more than 15 hours of meetings per week.
When 1 in 10 employees spends over 15 hours a week in meetings, you’re no longer dealing with occasional overload; you’ve normalised calendars that leave very little room for focused execution. That concentration of meeting time also correlates with burnout and fatigue: on days with heavy meeting loads, a large share of workers report feeling exhausted before they get to real work, which drags on performance and morale (Raconteur).
72% of professionals say clear objectives are key to effective meetings, and 67% say a clear agenda matters most
The basics still aren’t in place. 72% of professionals say clear objectives are the key to effective meetings, and 67% point to having a clear agenda as the most important element. Yet a significant portion of workers also report leaving meetings unclear on next steps or ownership.
That gap between what people know works and what actually happens in the room is where most meeting waste hides, you don’t need more tools, you need consistent discipline around goals, agenda, and outcomes. (Raconteur)
39% of meeting attendees admit to dozing off in a meeting
If 39% of attendees admit to literally dozing off in meetings, engagement is not a soft issue, it’s a hard signal that many sessions shouldn’t exist in their current form. That tracks with other behaviour: a large share of workers check email or multitask during meetings, effectively treating them as background noise rather than decision-making time. When people are half-present, you’re paying full price for half the value. (Quixy)
For a 100-person company, unproductive meetings can cost around $2.9 million annually
The financial impact is brutal once you roll it up. For a 100-person company, unproductive meetings can cost about $2.9 million per year, and for 5,000 employees that number can climb to $145 million annually.
Those aren’t theoretical modelled costs; they’re the direct result of hours spent in low-value sessions at real salary rates. Treating meeting optimisation as “nice-to-have” is how you quietly burn headcount-equivalent budgets without ever seeing a line item for it (Business Insider)
These stats focus on the cost, waste, and drag unproductive meetings create across organisations. Flowtrace data can help fix some of this, but the picture from broader research is very clear: most teams are still bleeding time and money on meetings that don’t move work forward.

Unnecessary or ineffective meetings waste about $25,000 per employee per year
When unproductive meetings cost around $25,000 per employee annually and $101 million a year for a 5,000-person organisation, you’re not dealing with “soft” inefficiency, you’re dealing with a silent line item bigger than many operating budgets.
A separate analysis estimates that unproductive meetings cost U.S. businesses $259 billion every year, which tells you this isn’t a niche problem limited to a few over-scheduled teams.
That wasted spend is locked up in recurring check-ins that don’t change decisions, status meetings that could have been async updates, and sessions where no one is clear on outcomes or ownership. (Bloomberg).
65% of people say they regularly waste time in meetings
When 65% of people say they regularly waste time in meetings, the issue isn’t just a handful of bad facilitators, it’s how most organisations use calendars.
If over a third of workers also believe unproductive meetings are their company’s biggest expense, it means employees can see the waste clearly even when leadership treats it as background noise. (MyHours)
Flowtrace data shows that smaller, more focused meetings (for example, six or fewer participants) tend to run shorter and stay on topic, but that benefit only shows up when there is a clear purpose and a defined end state, not just another standing slot.
78% of professionals feel they attend so many meetings that real work is hard to get done
With 78% of professionals saying they attend so many meetings that real work is hard to get done, meetings aren’t just inefficient, they’re actively blocking output. (Atlassian)
That lines up with the emotional side of the data: 76% of workers feel exhausted on days with heavy meeting loads. (Raconteur)
When the default move for every question, update, or decision is “let’s book time,” you end up with calendars that look full and pipelines that move slowly. Cutting invite lists, consolidating recurring sessions, and shifting simple updates into async channels are the levers that actually give people their working day back.
Roughly 90% report a productivity “meeting hangover” after too many meetings
The fact that around 90% of employees report a productivity “meeting hangover” after heavy meeting days shows the impact doesn’t stop when the calendar clears. (Raconteur).
People leave back-to-back sessions drained, context-switched, and behind on actual deliverables. At the same time, Flowtrace analysis shows that even small structural changes, like reducing average invite size by 27% and removing just two unnecessary attendees from each 30-minute meeting, can recapture full days of productive time every 100 meetings.
The gap between those two realities is the opportunity: turning meetings from an energy sink into a deliberate, limited tool for decisions and alignment.
Understanding how much time meetings actually consume is key to judging whether they are justified. The data shows that across roles, industries, and company sizes, meetings occupy a large chunk of the week, often without a clear link to outcomes.
Managers and directors spend an average of 13 hours per week in meetings
For managers and directors, meetings are no longer just coordination tools; they are the job. Spending 13 hours per week in meetings, more than a fifth of the workweek, leaves limited time for deep work, strategy, or 1:1 coaching.
Executive leaders are not far behind, with the average executive clocking at least 12 hours per week in meetings. (Rev)
This concentration of time at the top often cascades down, as each senior meeting generates new check-ins, updates, and follow-ups for teams beneath them.
Meeting load peaked at 21.5 hours per week before settling at 14.8 hours
During the peak of remote and hybrid adjustment, average weekly meeting time hit 21.5 hours per week, more than half a 40-hour workweek spent in live calls. (Zoom)
While that load has since dropped to 14.8 hours, it still represents nearly two full days of the week tied up in synchronous conversations.
At the same time, survey data shows 85% of UK workers and 78% of U.S. workers still spend at least 3+ hours per week in meetings, indicating that the structural reliance on meetings remains deeply embedded even as volumes fluctuate. (Calendly)
Employees at large enterprises attend 18 meetings per week, compared to 12 at small firms
Scale makes a difference. Employees at small firms attend around 12 meetings per person per week, while those at enterprises with 500+ staff see that number climb to 18 meetings per week. (MyHours)
That’s not just more calendar clutter, it’s more context switching, more fragmented days, and a higher risk of “meeting for meeting’s sake.” Supporting data shows that 46% of workers now attend 3 or more meetings per day, a pattern that leaves limited uninterrupted time to actually execute on what those meetings produce.
Half of sales professionals spend over 5 hours per day in meetings
In some roles, meeting time is almost the entire job. 50% of sales professionals report spending more than 5 hours per day in meetings, effectively running their workday inside calls. (Calendly)
From a systems perspective, Flowtrace’s data showing 1.75 million hours of tracked meetings in 2025 underscores just how much time is tied up globally in live conversations.
The question for leaders isn’t whether meetings are necessary, it’s whether that volume of synchronous time is translating into pipeline movement, customer outcomes, or internal decisions, or simply eroding the capacity to deliver.
Virtual and hybrid meetings are no longer a temporary adaptation, they’re the default collaboration layer for many teams. The stats show a mixed picture: virtual meetings are seen as essential and productive by many, but also cause fatigue, exclusion, and a lot of multitasking.

82.9% of professionals believe not all video meetings require video
Almost 83% of professionals agree that not every virtual meeting needs cameras on, which points to a mismatch between culture and necessity. (Dialpad)
Teams often default to full video calls for updates that could be async or audio-only, adding fatigue without adding clarity. At the same time, 68% of people say virtual meetings are crucial for team project progress, showing that the format itself isn’t the problem — it’s how casually camera-based meetings are used for low-value interactions. (Calendly)
58% of introverts experience Zoom fatigue, compared to 40% of extroverts
Virtual meeting fatigue isn’t evenly distributed. 58% of introverts report Zoom fatigue versus 40% of extroverts, suggesting that “always on” video cultures can quietly disadvantage large portions of the team. (Yahoo Finance)
Behavioural data backs this up in more subtle ways: 21% of professionals take Zoom meetings while walking or jogging, and 15% of remote workers perform house chores during online meetings. (Zoom)
When people are physically moving or multitasking just to get through calls, the meeting format is working against attention, not supporting it.
55% of remote employees think most meetings could have been an email
More than half of remote employees (55%) believe that the majority of meetings they attend could have been an email. (Calendly)
That’s a clear signal that many virtual sessions exist because the calendar makes it easy to invite people, not because live discussion is the best medium. Meanwhile, 50% of employees have spent at least 1–3 hours per week in Zoom meetings since COVID began, locking in a habit of “quick calls” that accumulate into major time drains. (Quixy)
The opportunity is to reserve live virtual meetings for decision-making, alignment, and complex collaboration, and push everything else into async updates or recorded Looms.
In U.S. organisations, 42% of meetings are via video, 38% hybrid, and 20% fully in-person
Meeting formats have flipped. In U.S. organisations, 42% of meetings now take place via video, 38% are hybrid, and only 20% are fully in-person. (Owl Labs)
Yet the infrastructure hasn’t fully caught up: nearly 3 in 4 workers have experienced delays from audio/video problems, and only 37% of organisations upgraded video meeting tech in 2023. (Zoom)
The result is a world where virtual meetings are the norm but still fragile, highly dependent on tools, bandwidth, and behaviours that not every team has tuned properly.
Meeting overload isn’t just “a lot of meetings”, it’s the point where collaboration actively competes with execution, deep work, and focus. The stats show a pattern of constant interruptions, multitasking, and defensive behaviours like calendar blocking, all driven by calendars that are too full and too fragmented.

54% of professionals believe they attend more meetings than before the pandemic
More than half of professionals (54%) feel they’re attending more meetings than they did before the pandemic. (Microsoft)
Hybrid and remote work didn’t simplify calendars; it multiplied them. When the default answer to any uncertainty is “let’s jump on a call,” days become a sequence of back-to-back sessions with little room to actually execute. Supporting this, 47% of professionals say meetings waste their time the most at work, which is a blunt verdict on how overloaded many calendars have become. (Electro IQ)
55% of employees multitask during meetings
With 55% of employees multitasking during meetings and 69% checking email at the same time, overload doesn’t just inflate the calendar, it erodes attention. (Leadership IQ)
People show up physically but split their focus between inboxes, chat, and whatever they were working on before the meeting started. On top of that, the average professional spends 1 hour and 9 minutes preparing for each meeting, which means the true cost of every session includes both scheduled time and a non-trivial prep load. (View Sonic)
Meetings, chat, and email consume 57% of work time, leaving 43% for focused solo work
Microsoft data shows that meetings, chat, and email now consume 57% of work time, leaving just 43% for focused solo work. (Microsoft)
That ratio makes it hard to make meaningful progress on deep tasks that require concentration, context, and continuity. No surprise, then, that 40% of professionals report wasting up to 30 minutes just searching for a collaborative space for meetings, time lost before the meeting even starts. (Microsoft)
Overload is not just about how many meetings exist; it’s how much operational drag the whole meeting ecosystem creates around them.
58% of employees use calendar blocking to protect focus time
As a defensive response, 58% of employees now use calendar blocking to carve out focus time. (Owl Labs)
The behaviour is especially pronounced for full-time office workers, 64% of whom block time, compared to 28% of hybrid and 8% of fully remote employees. (Owl Labs)
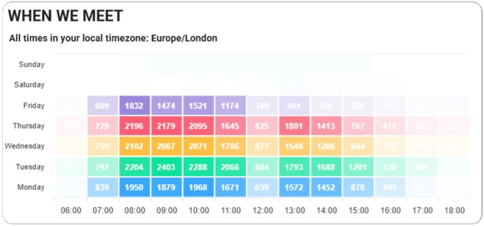
Flowtrace data shows that when organisations concentrate collaboration into defined core hours, rather than scattering meetings across the entire day, they create predictable windows for deep work and reduce the sense of constant interruption.
Beyond time, overload, and format, there are broader behavioural and preference patterns that show how people actually experience meetings — from preferred formats and times to generational differences and the cost of poor design.
72% of professionals say clear objectives are the key to effective meetings
The basics are still the biggest gap. 72% of professionals say clear objectives are the key to effective meetings, and 67% say a clear agenda is the single most important element. (Atlassian)
Yet 62% of workers frequently attend meetings where the goal isn’t even mentioned in the invite, and more than half often leave unclear about next steps or ownership. (Atlassian)
This is where simple hygiene, writing a proper agenda, stating outcomes, assigning owners, does more than any new tool or framework.
67% of employees would choose an in-person meeting for important decisions
Despite the rise of virtual collaboration, 67% of employees would choose an in-person meeting for important decisions, with only 31% preferring a video call in those moments. (Robert Walters)
At the same time, 78% of business leaders say internal, face-to-face meetings are “absolutely necessary” or “very important,” reflecting a belief that some work, alignment, trust-building, sensitive discussions, are still best done in the room. (Cvent / Harris Poll)
The implication is not that everything should be in-person, but that format should be chosen based on the decision at stake, not habit or convenience.
The average CEO has at least 37 meetings per week, taking up 72% of their workweek
At the top of the organisation, the calendar becomes the operating system. The average CEO has at least 37 meetings per week, consuming about 72% of their time. (Rev)
That sends a strong signal to the rest of the company: decisions happen in meetings, status is reported in meetings, and progress is reviewed in meetings. Combined with the fact that the U.S. workforce runs about 55 million meetings every week, it’s easy to see how meeting-led culture becomes the default unless consciously redesigned. (Rev)
There has been a 20% decrease in average meeting length since early 2020
On the positive side, there has been a 20% decrease in the average length of a meeting since early 2020, driven by remote work, virtual formats, and greater comfort with short, focused sessions. (Rev)
Flowtrace data supports this shift: median meeting durations sit firmly in the sub-hour range, and organisations that standardise shorter slots see fewer overruns and better engagement. When shorter meetings are paired with clear objectives and lean invite lists, they become a lever for reclaiming time without losing alignment.
Flowtrace’s 2024 data showed a meeting culture defined by long-standing inefficiencies: half of all meetings started late, agenda discipline was weak (64 percent of recurring meetings and 60 percent of one-off meetings lacked a clear plan), and participant lists were often bloated, with 29 percent of recurring meetings pulling in seven or more people.
Most meetings were booked for the default hour (94 percent scheduled for 60 minutes or less), yet many still overran or delivered limited value due to minimal preparation. Even shorter sessions struggled to stay productive, with 21 percent of agendas containing fewer than 500 characters and nearly half of one-off meetings involving only two participants, reflecting fragmented, ad-hoc coordination rather than structured alignment.
Overall, the 2025 data reflects a transition from reactive, unstructured meetings toward faster, smaller, better-prepared sessions that align more closely with high-performance collaboration standards.
The meeting statistics provide a compelling overview of the current state of meetings in the business world. They underscore the necessity for organizations to continually evaluate and refine their meeting practices. By focusing on effective meeting management, leveraging technology, and respecting the balance between collaborative needs and individual productivity, businesses can ensure that their meetings are not only frequent but fruitful, contributing positively to organizational success and employee satisfaction.
Academic Sources
Discover essential meeting analytics to track, improve collaboration efficiency, and boost productivity in your company. Learn how to use data to...
Streamline meetings with a manifesto to reclaim focus time. Learn to craft, implement, and measure meeting principles for fewer, clearer, and more...
Optimize your organization's meetings with Strategic Meeting Management. Learn how to transform meetings from time-draining activities into strategic...